
Legal AI Was Missing the One Thing Clients Actually Need
Drafting and research were never the bottleneck. Understanding was. Claude just got a whiteboard.


Claude Just Turned Chat Into a Visual Workbench for Attorneys
TL;DR: One of the biggest gaps in legal AI has been turning words into something clients, partners, and courts can grasp fast. Anthropic’s new inline visualization feature in Claude starts to close that gap. Attorneys can now build interactive timelines, flowcharts, and scenario models directly in the conversation, making AI more useful for client communication, case strategy, and live decision-making. I spent the afternoon testing it and came away genuinely impressed.
I was standing in front of 200 family lawyers this morning, mid-sentence in my AI keynote for the American Academy of Matrimonial Lawyers, when my phone started buzzing.
Anthropic had just shipped something big.
You can’t make this stuff up. I’d spent the last hour telling this room full of attorneys that AI tools are getting more visual, more interactive, and more useful for client-facing work. And while I was literally saying it, the proof landed.
It was one of those events where everything clicks. Great questions. Real curiosity. Serious attorneys trying to sort signal from noise. And then the news broke that Claude can now create interactive charts, diagrams, and visualizations directly in the chat itself. Not in a separate panel. Not as a static image you screenshot and paste somewhere. Right in the conversation, where you can interact with it, ask for changes, and keep iterating.
Anthropic describes these visuals as inline and temporary. They show up in the conversation, change as the discussion moves forward, and they’re separate from Claude’s existing Artifacts feature (which creates persistent files in a side panel you can download). Basically, Claude got a whiteboard. The feature is in beta, it’s on by default for all Claude users, and yes, it works on the free plan too.
Sounds small. It’s not.
For years, legal AI demos have leaned heavily on drafting, summarizing, and research. All useful. But the real work of law often lives in the gap between the words and the decision. It lives in the timeline you sketch on a yellow pad during intake. The inheritance path you draw for a confused client on the back of a legal pad. The damages model you’re hacking together in Excel while a partner leans over and asks, “Okay, but what happens if we assume twelve months instead of eighteen?”
That gap is where this thing starts to matter. It turns chat from a text-only assistant into something closer to a visual workbench. Not a replacement for polished trial graphics. Not a replacement for your final spreadsheet model. But a way faster path to understanding. And honestly, understanding is where better strategy starts.
I spent the afternoon testing this with real legal workflows. Here’s what I found.
Start with timelines. Every litigator needs this.
This is the most universal use case. Probably the one that spreads the fastest too.
Litigators live in timelines. Family lawyers, IP attorneys, employment folks, anyone touching a fact-heavy dispute. You’ve got emails, filings, text messages, agreements, meetings, disclosures, court deadlines. The facts matter, but the sequence? That often matters more.
The old way is painfully familiar. Collect the events, dump them into notes, export to a spreadsheet, clean it all up, then maybe, eventually, turn it into something visual in PowerPoint. It works. It’s also slow as hell. And the visual usually comes last, after the thinking is already underway. Which kind of defeats the purpose.
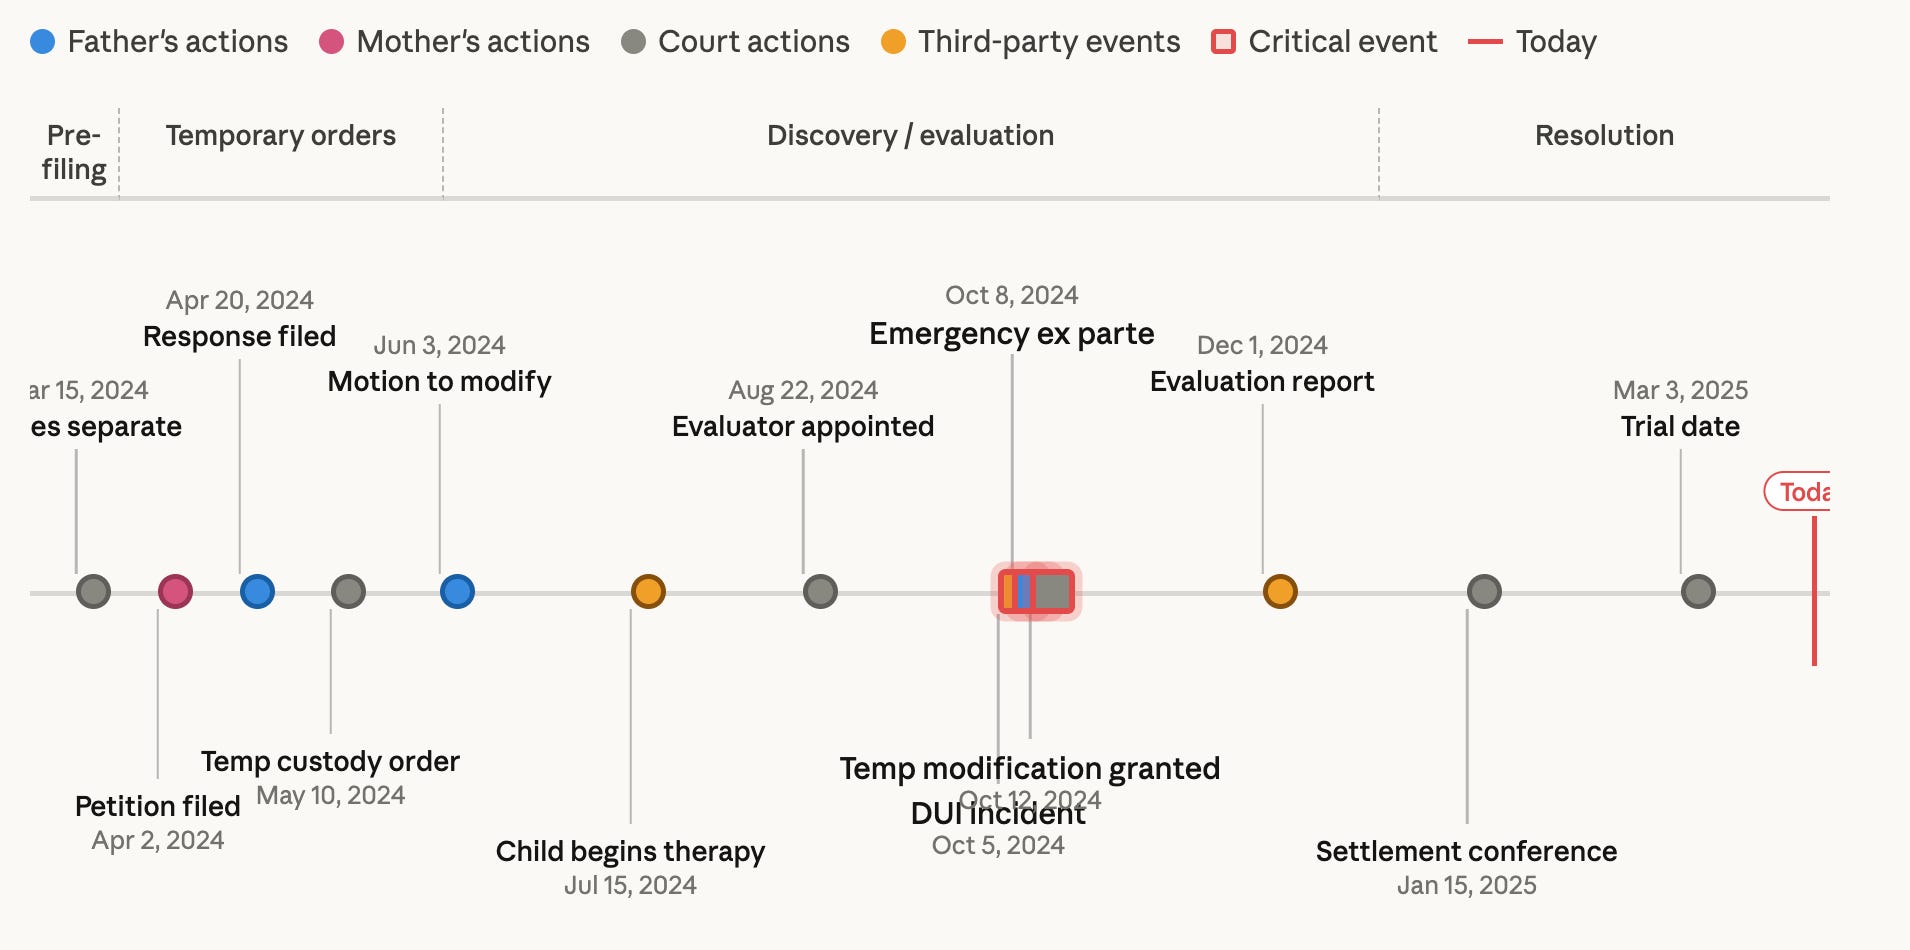
This flips that. You stay in the conversation and just say, “Here are the critical events. Build me an interactive timeline. Group by party. Highlight gaps. Color code financial events versus custody events.” Claude builds it in about 30 seconds. You click through it, tweak it, keep going.
Very different workflow. You’re not waiting until the end to visualize the case. You’re using the visual to understand the case sooner.
For a family lawyer, that could mean showing the arc of separation, support changes, hidden spending, and communication patterns all in one view. For a business dispute, maybe it’s contract amendments next to internal warnings next to customer impact. For trial prep, it’s a gut check: does your story actually hang together when you lay it out visually?
Client meetings are where this really sings, though. Clients tell their story emotionally, not chronologically. Totally normal. But it makes legal analysis harder. A visual timeline brings order to the facts in real time. It calms the conversation down. Exposes missing information. Shows a client, quickly, why one fact matters more than another.
That alone can save hours. Maybe more importantly, it can lead to better conversations earlier in the case.
Now think about estate planning
Okay, different practice area, same underlying problem.
Estate planning attorneys know something clients often don’t: understanding the documents is not the same as understanding what actually happens.
This might be the biggest communication problem in estate planning. The attorney sees a clean structure. Revocable trust, pour-over will, subtrusts, beneficiary designations, contingencies, distributions at certain ages, successor trustees. Makes total sense from the lawyer’s side of the desk.
The client hears a lot of words and leaves with a vague sense that “the plan is handled.” Maybe.
That’s not great. Not for trust. Not for closing the engagement. Definitely not for reducing the confusion that hits families later when it actually matters.
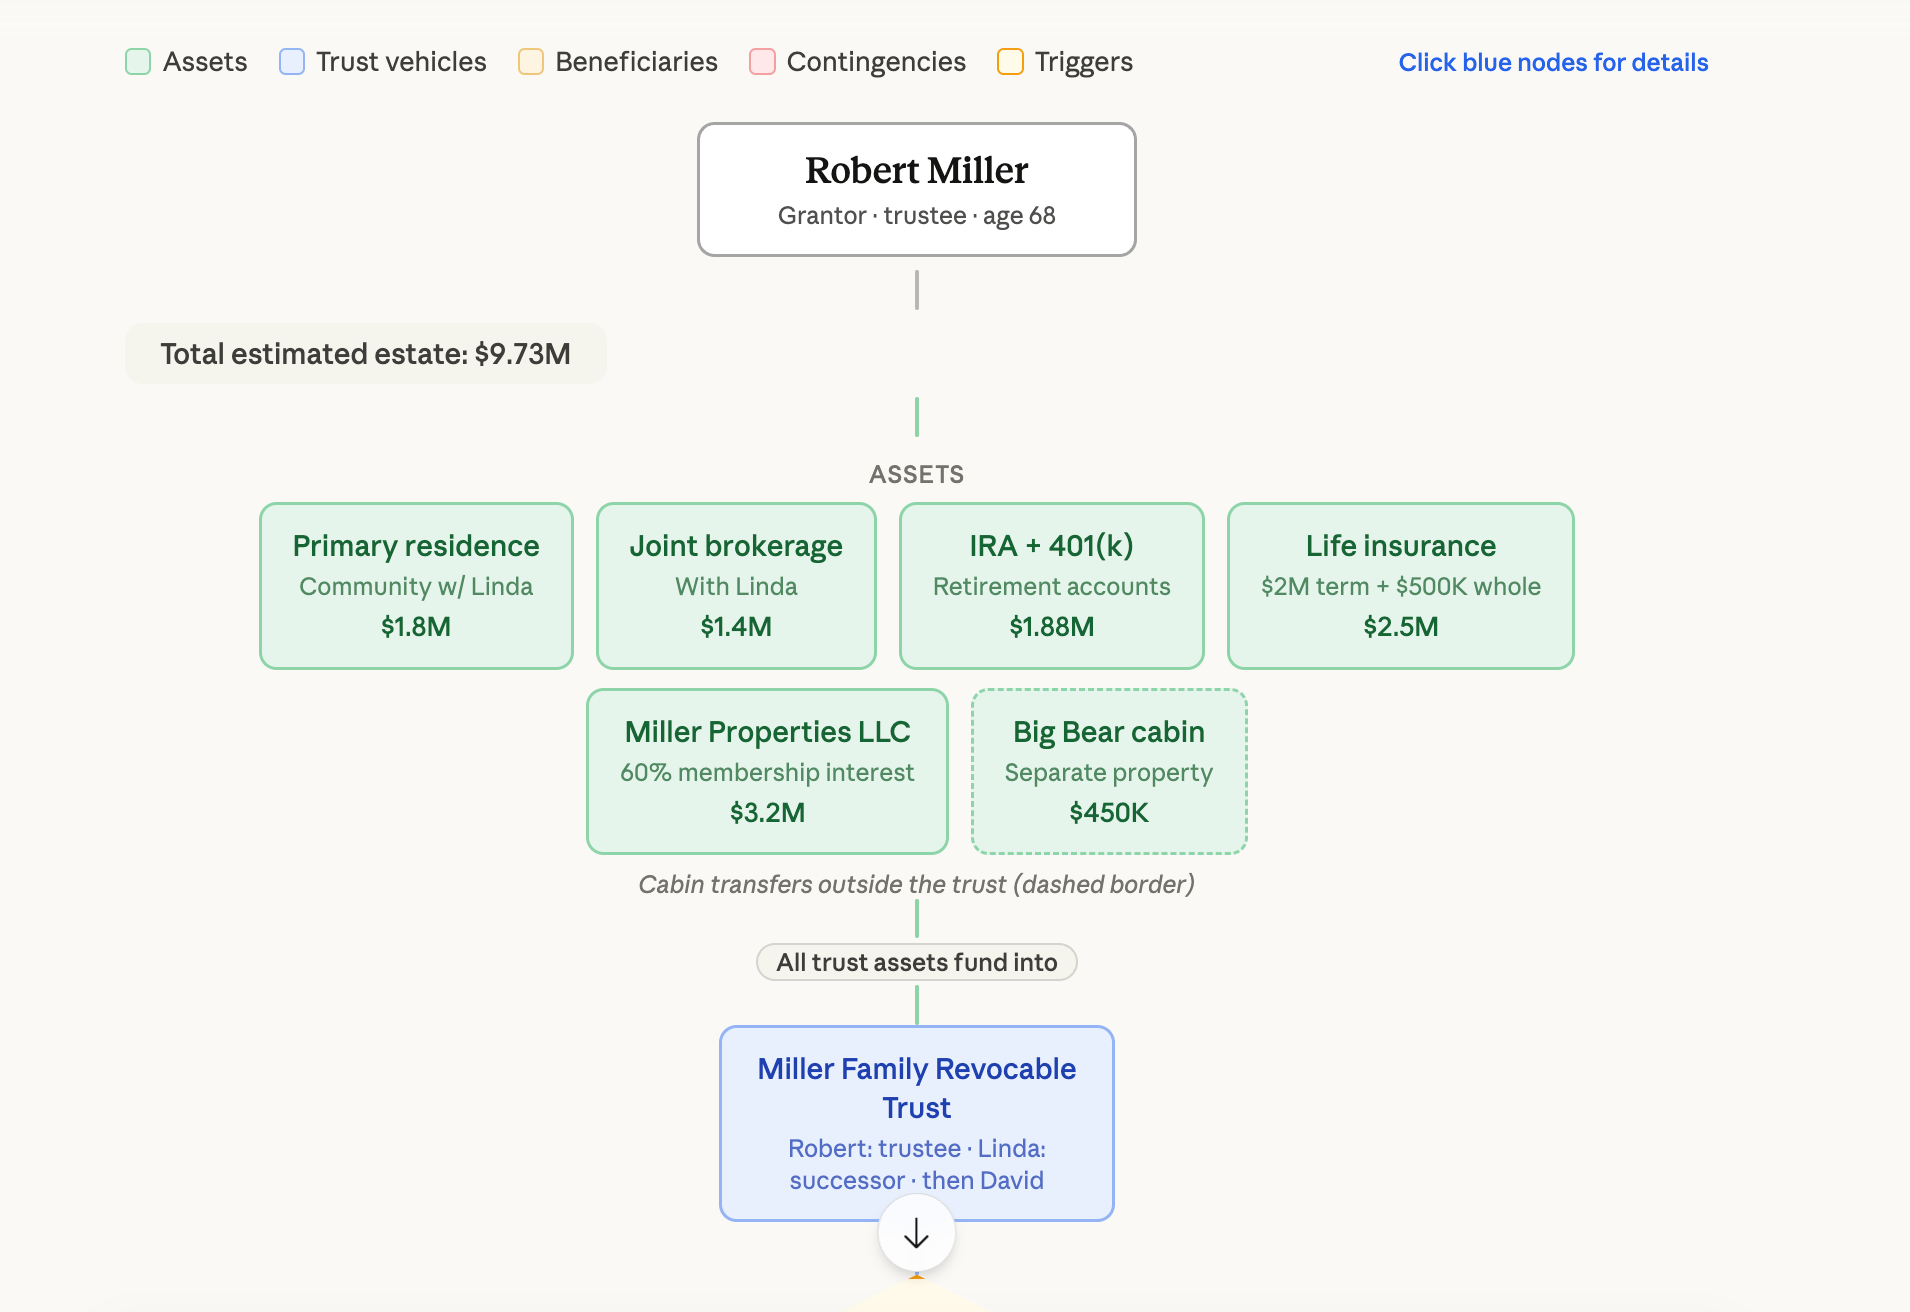
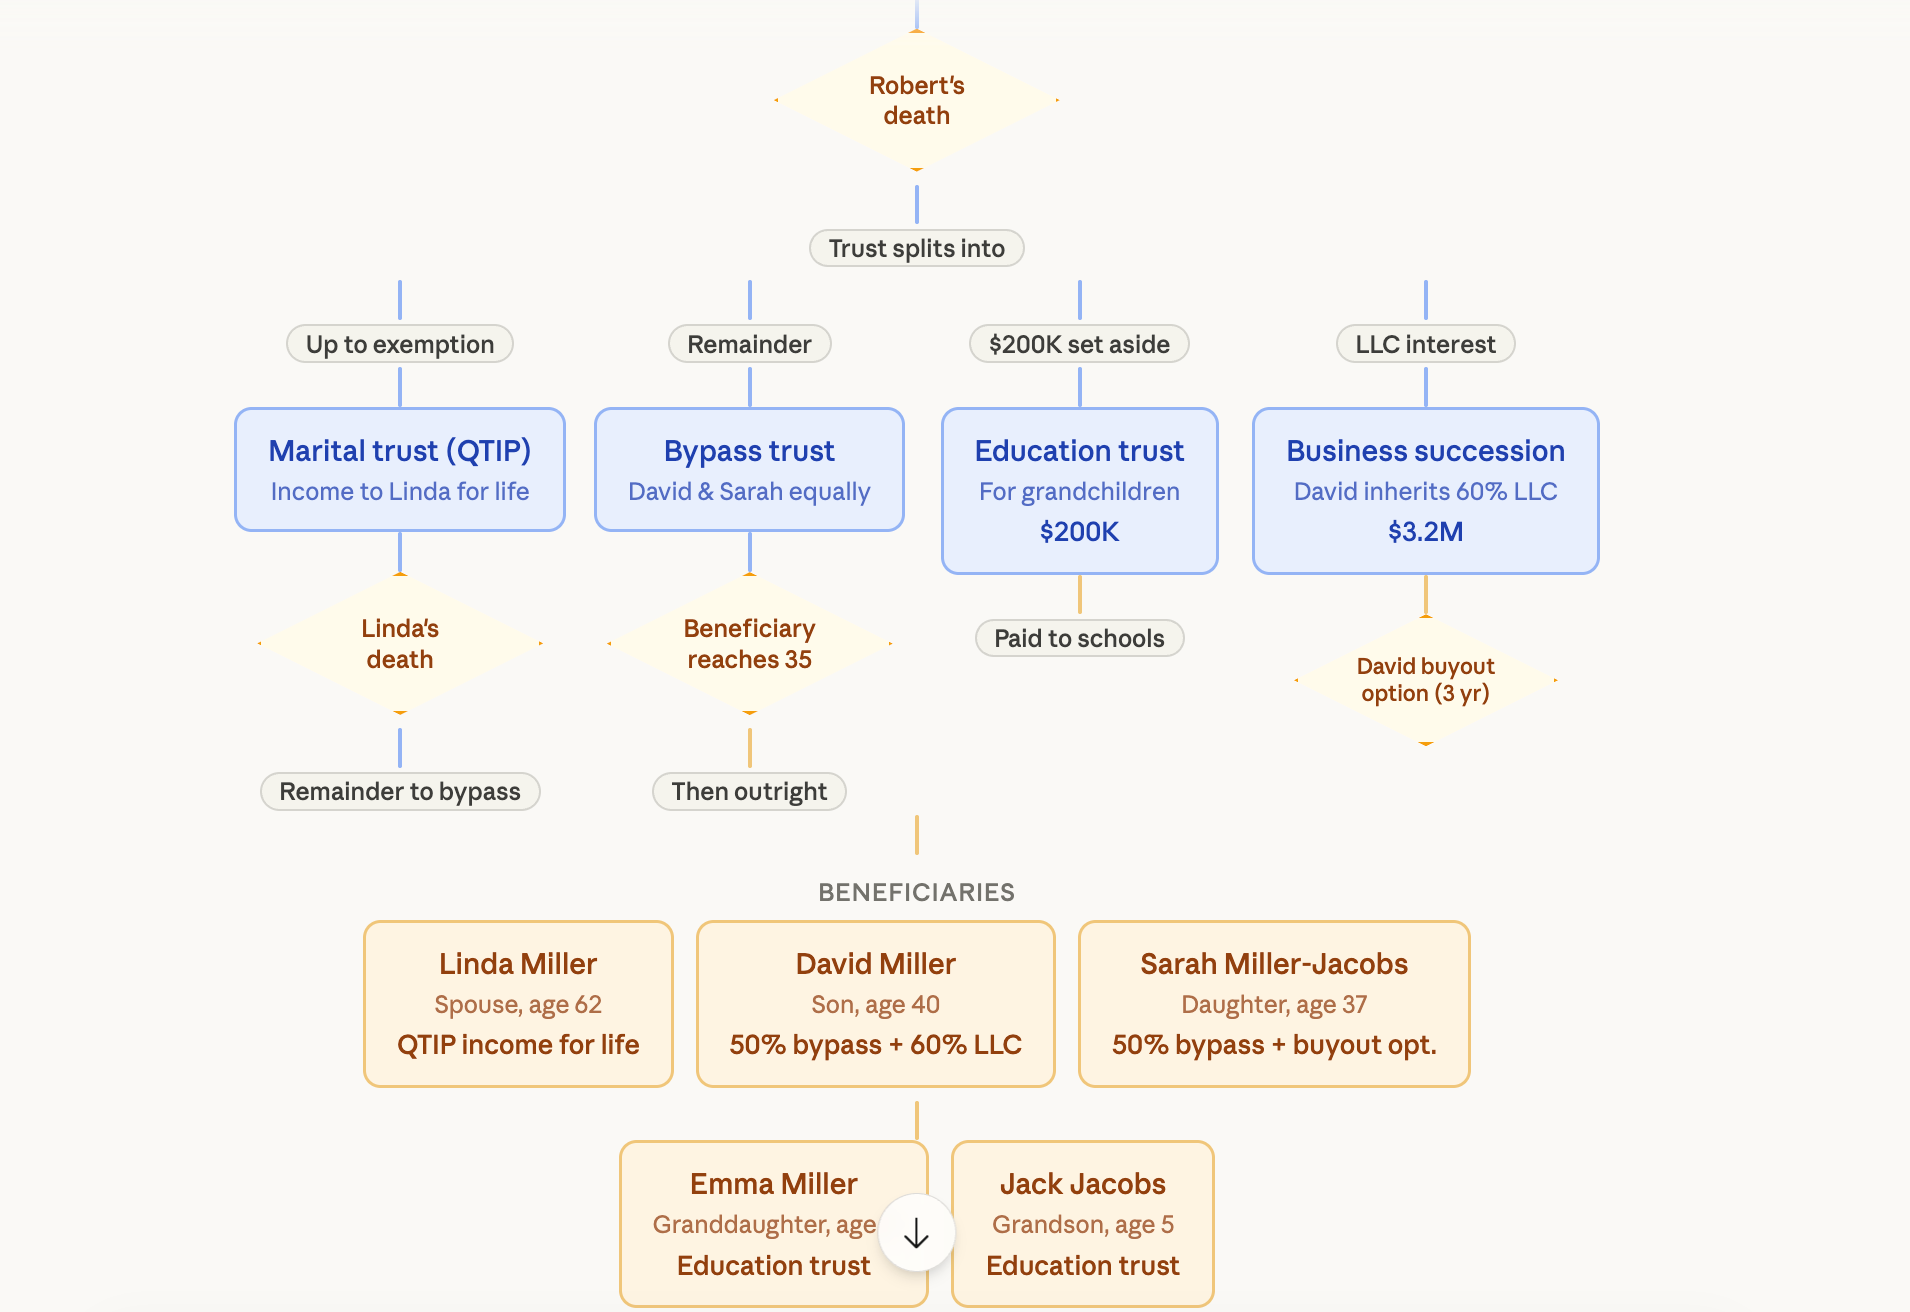
So I tested this. Described a moderately complex estate plan to Claude: revocable trust with subtrusts for a surviving spouse and children, some assets passing outside the trust through beneficiary designations, and a charitable remainder trust thrown in for good measure. Asked Claude to show how everything moves. What came back was a clean, interactive flowchart showing exactly how assets flow from the client through each vehicle to each beneficiary. Click into different nodes and you get the detail.
Now imagine saying to a client: “Let me show you how the house, brokerage account, life insurance, and business interest move if you die first. Now here’s what changes if your spouse dies first. Now here’s what happens if one child predeceases.” Tell me that doesn’t land differently than a 20-minute verbal explanation.
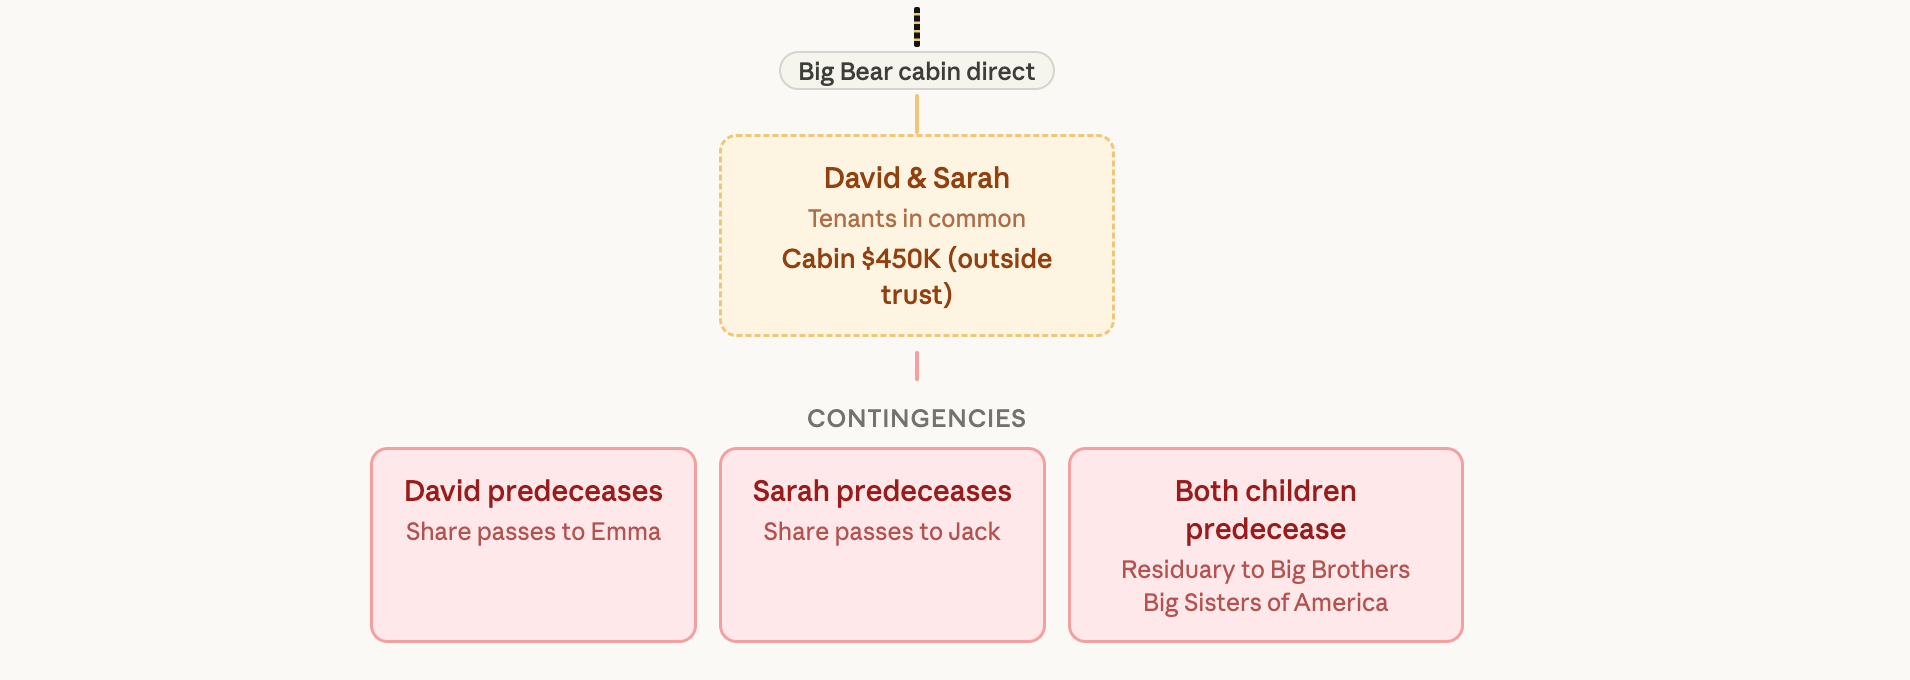
Sometimes the visual confirms the plan. Sometimes it reveals that the plan is elegant on paper and confusing in real life. Both are worth knowing.
Here’s the part that’ll get the managing partners’ attention: when a prospective client really sees the value of the planning, not just hears about it, engagement gets easier. The work feels concrete instead of abstract. The attorney looks more prepared. And that closes engagement letters faster. Full stop.
I wouldn’t hand this to a client as the final deliverable without careful review. But as a live communication tool in a meeting? Yeah. This is really promising.
The one that surprised me: damages modeling
This is the one that got me most excited this afternoon.
Because this is where interactivity stops being a visual convenience and turns into an actual strategic tool.
Lawyers already model outcomes. Damages. Support scenarios. Buyout ranges. Lost profits. But most of that work lives in static spreadsheets. Someone prepares the model. The team talks about the model. Someone goes back and changes assumptions. Then you talk about it again. The analysis and the conversation never happen at the same time, and that’s a problem nobody really talks about.
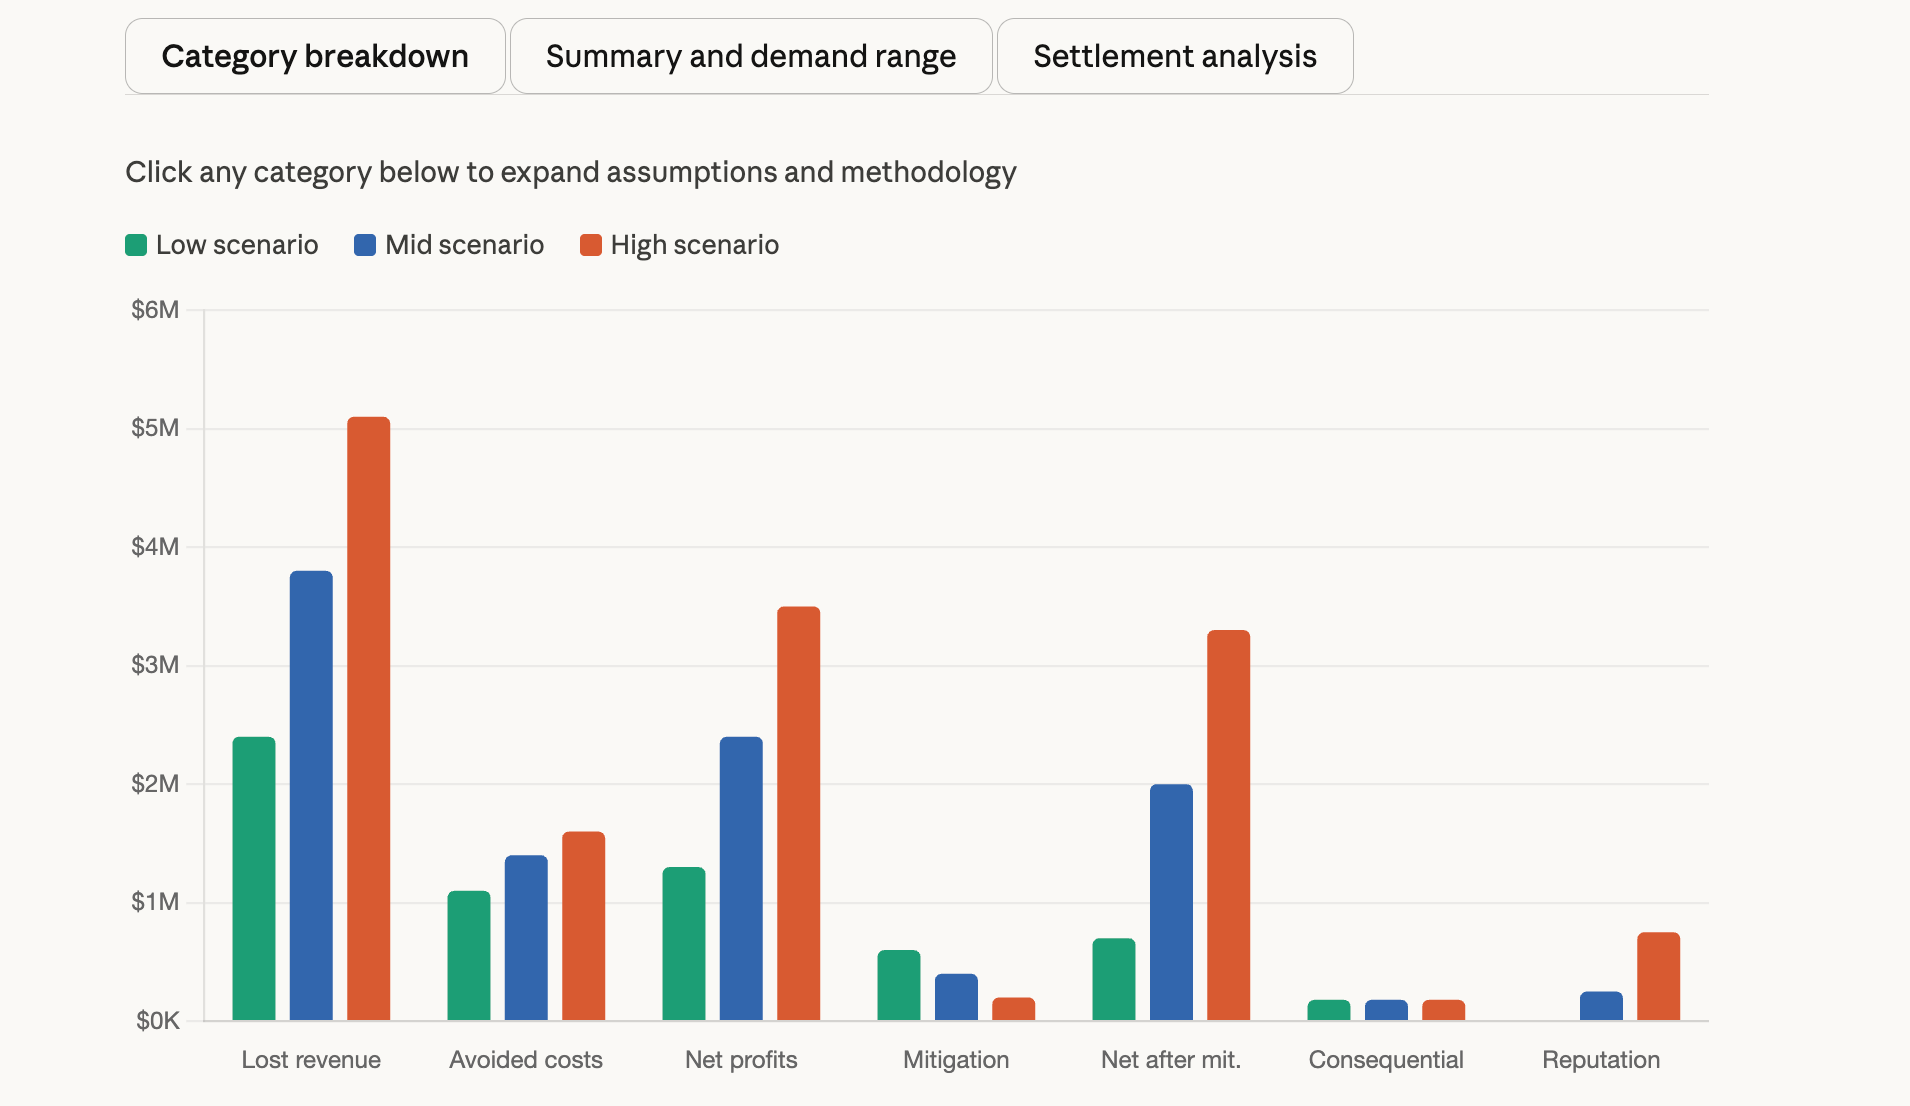
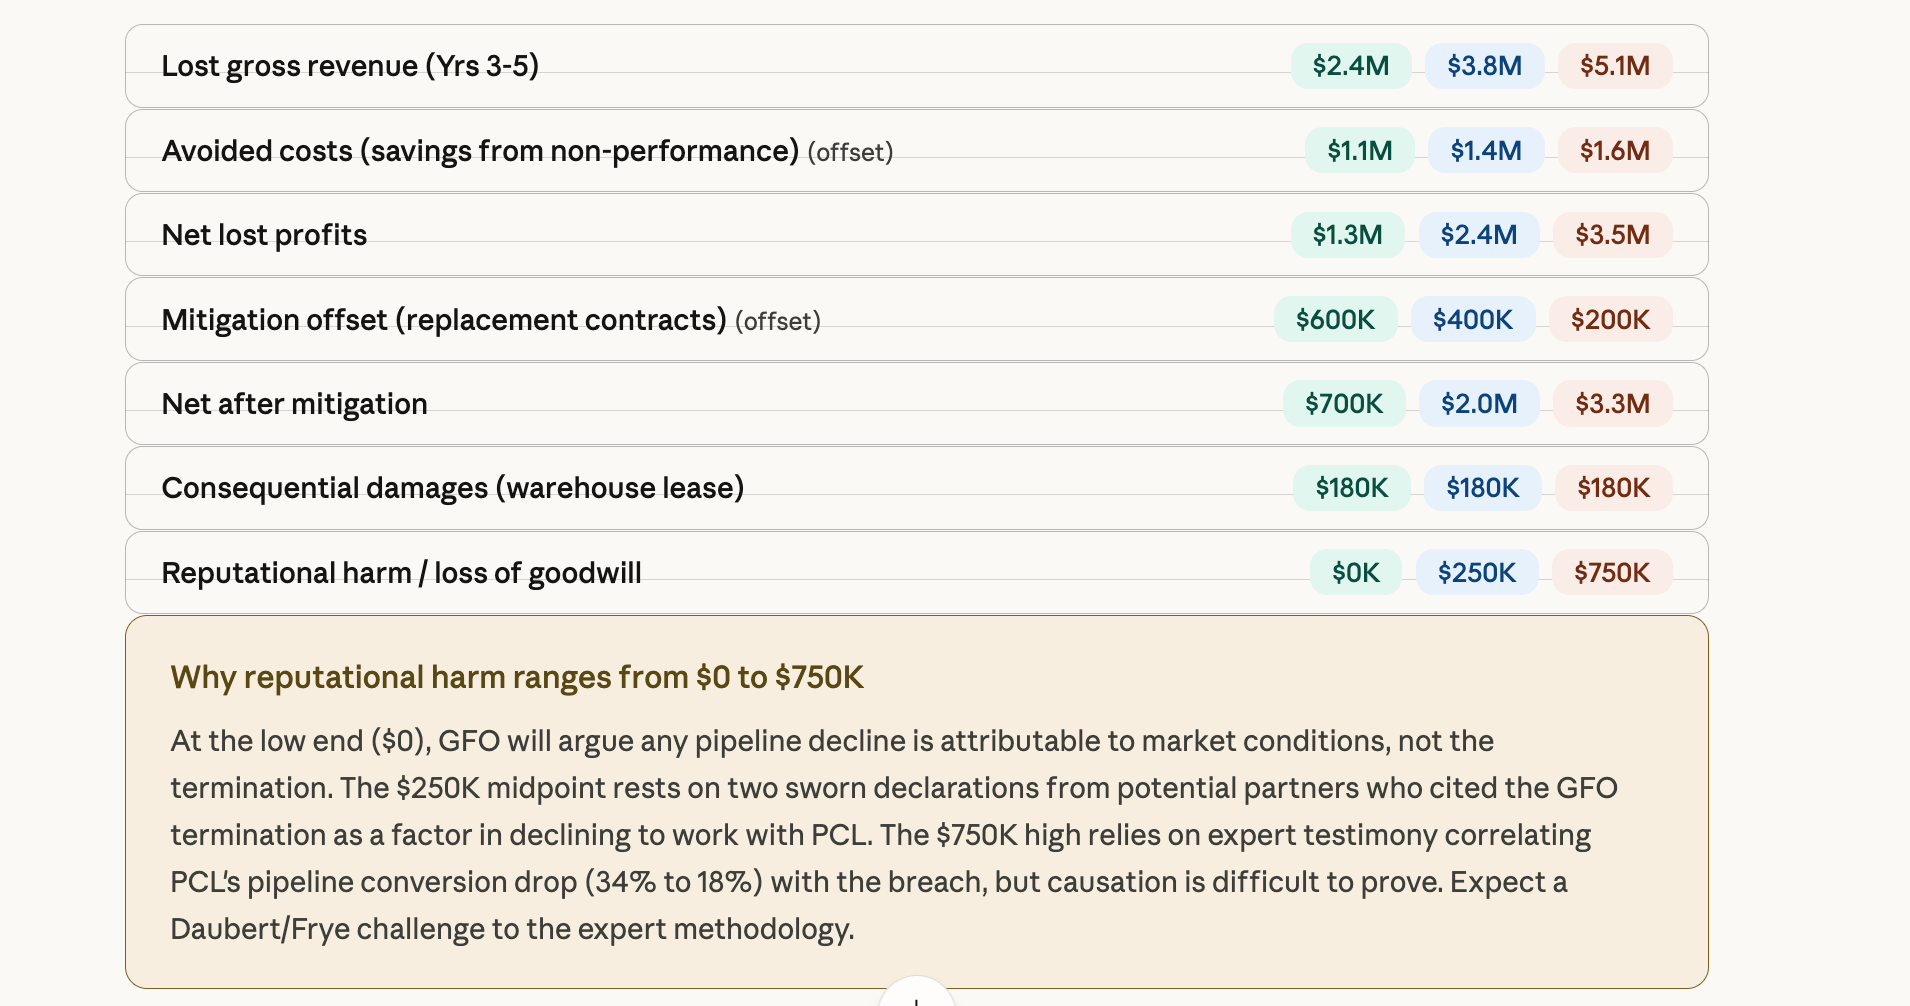
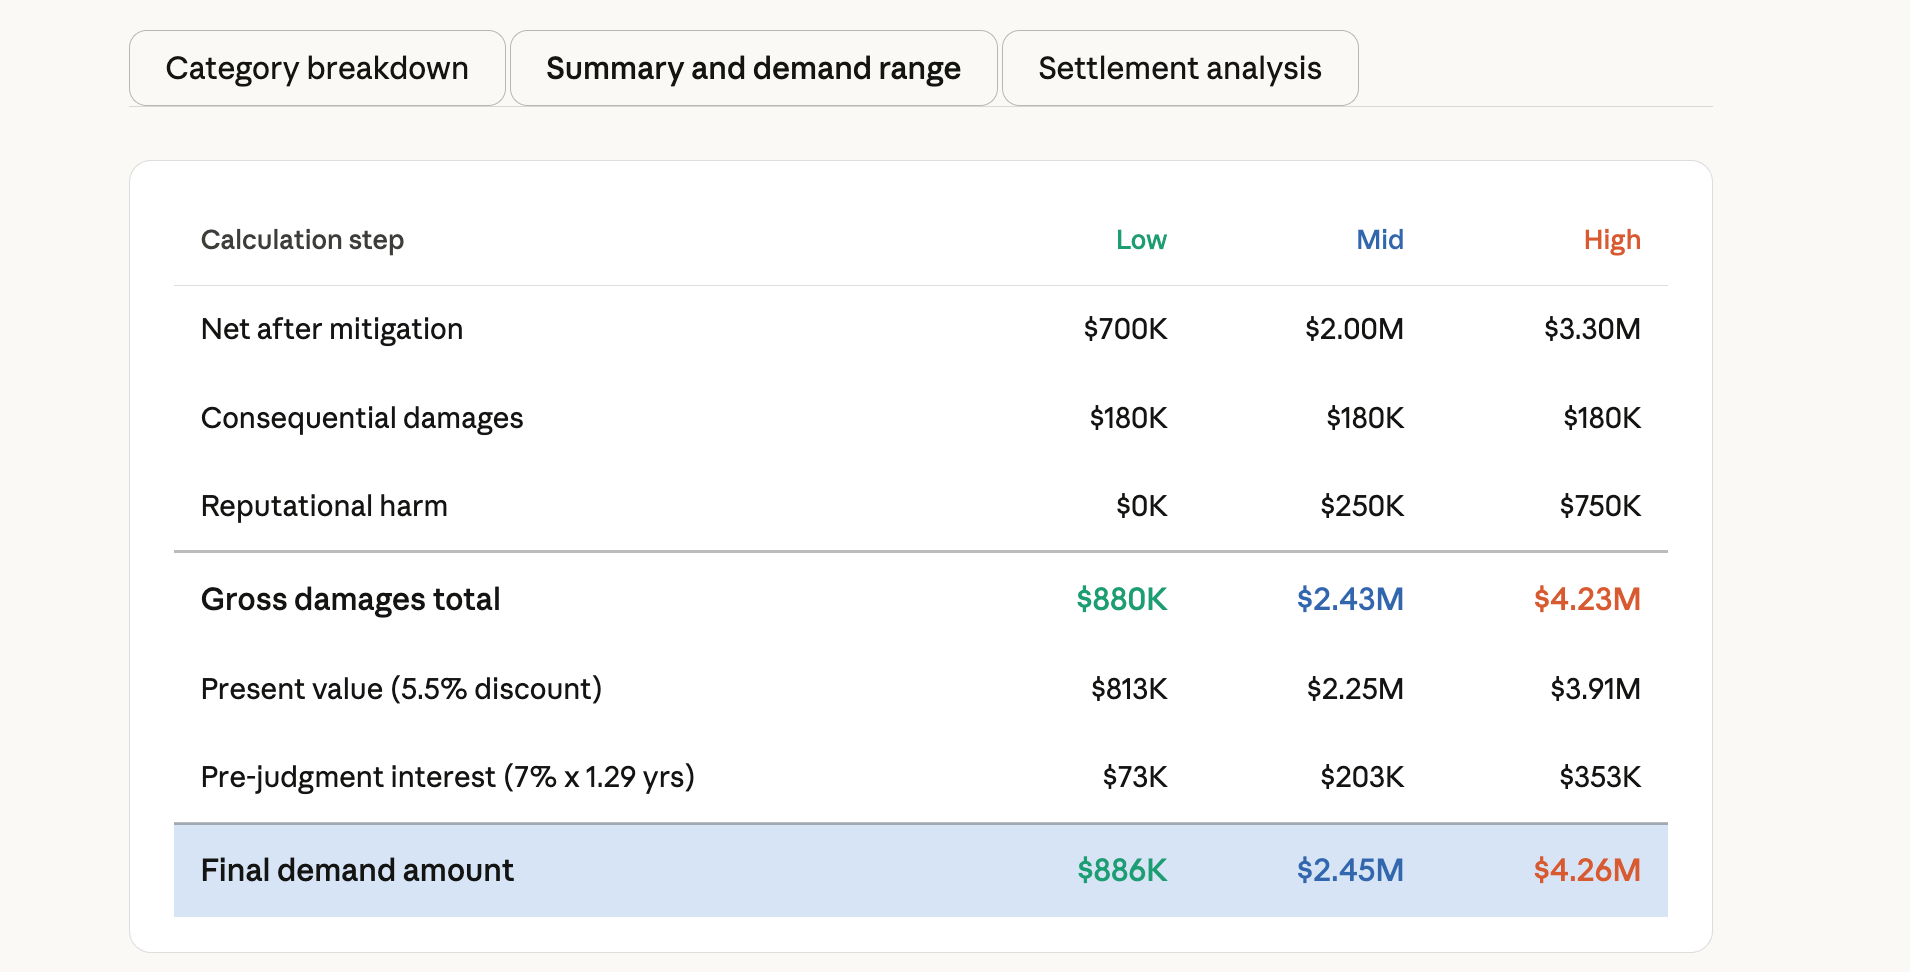
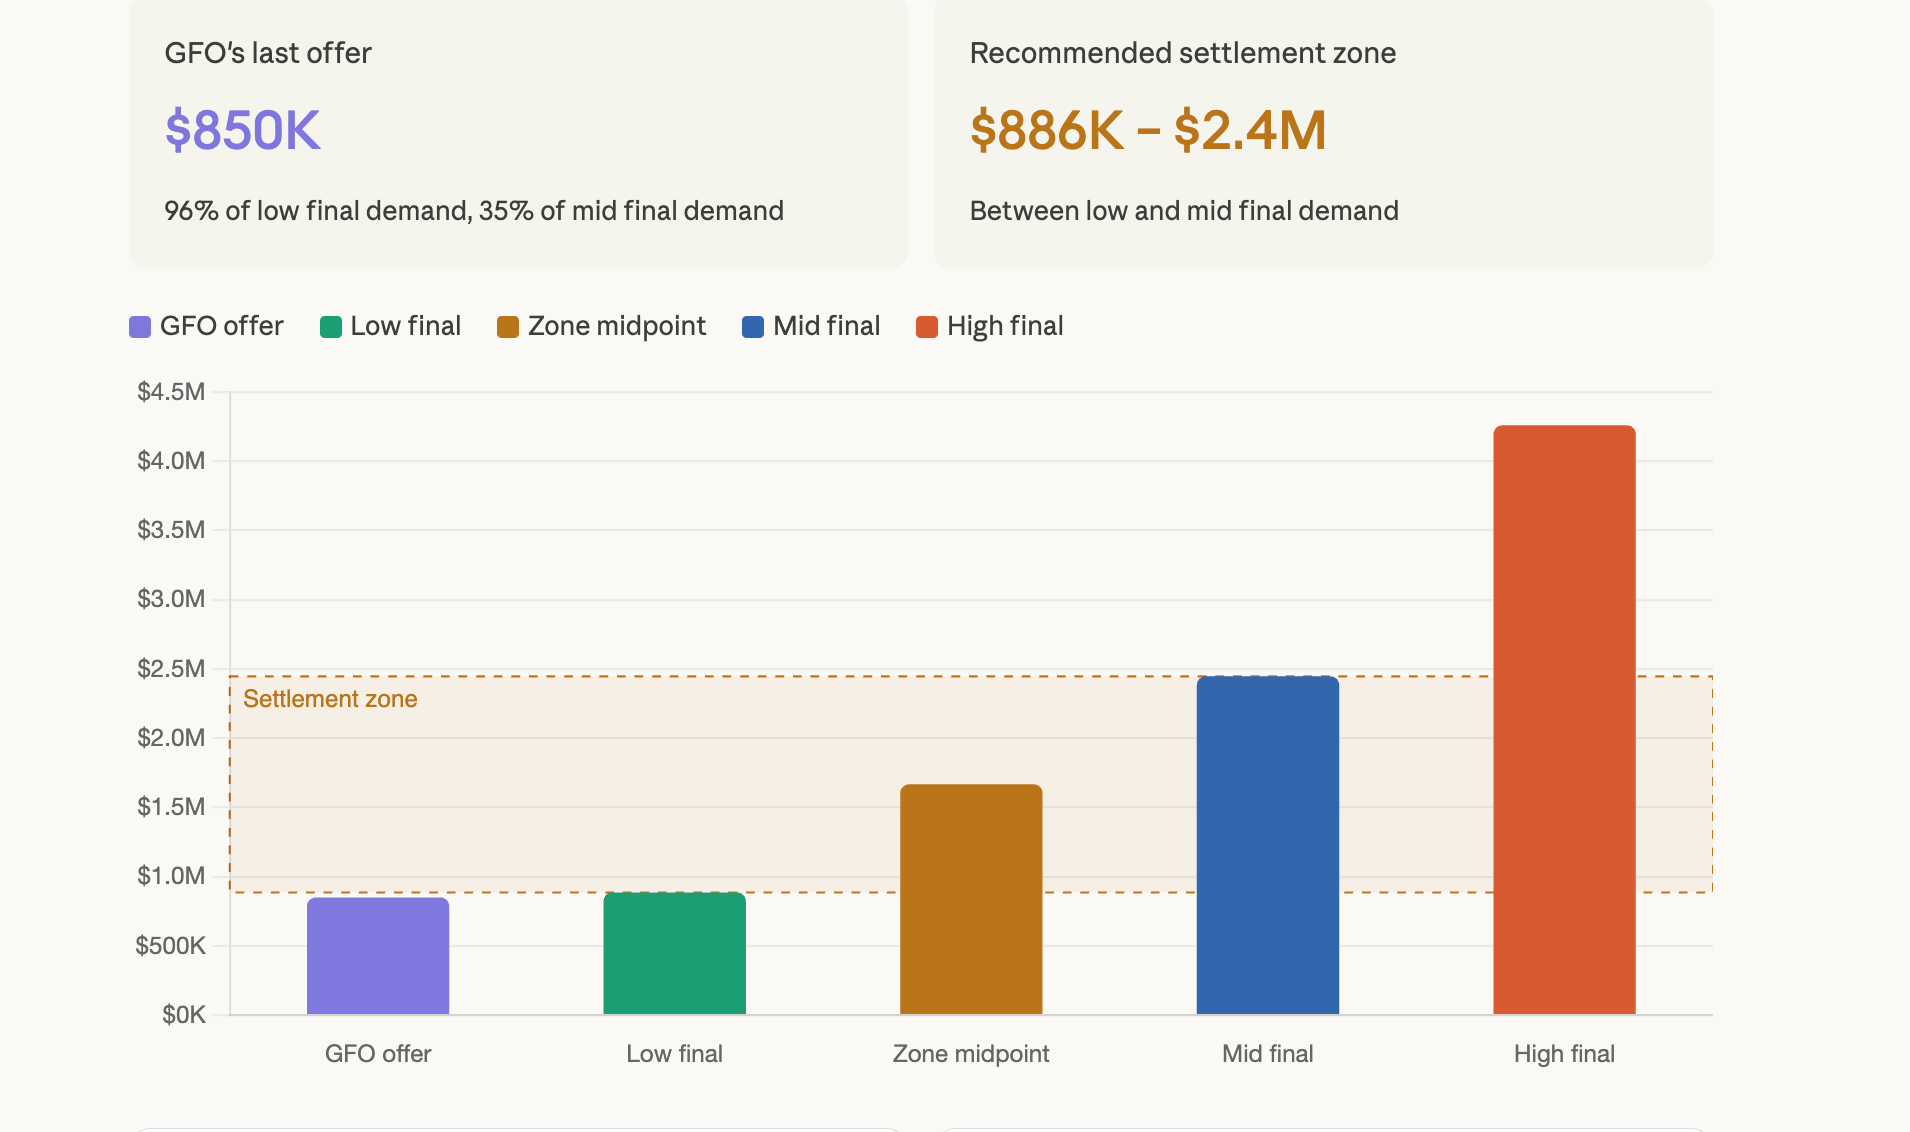
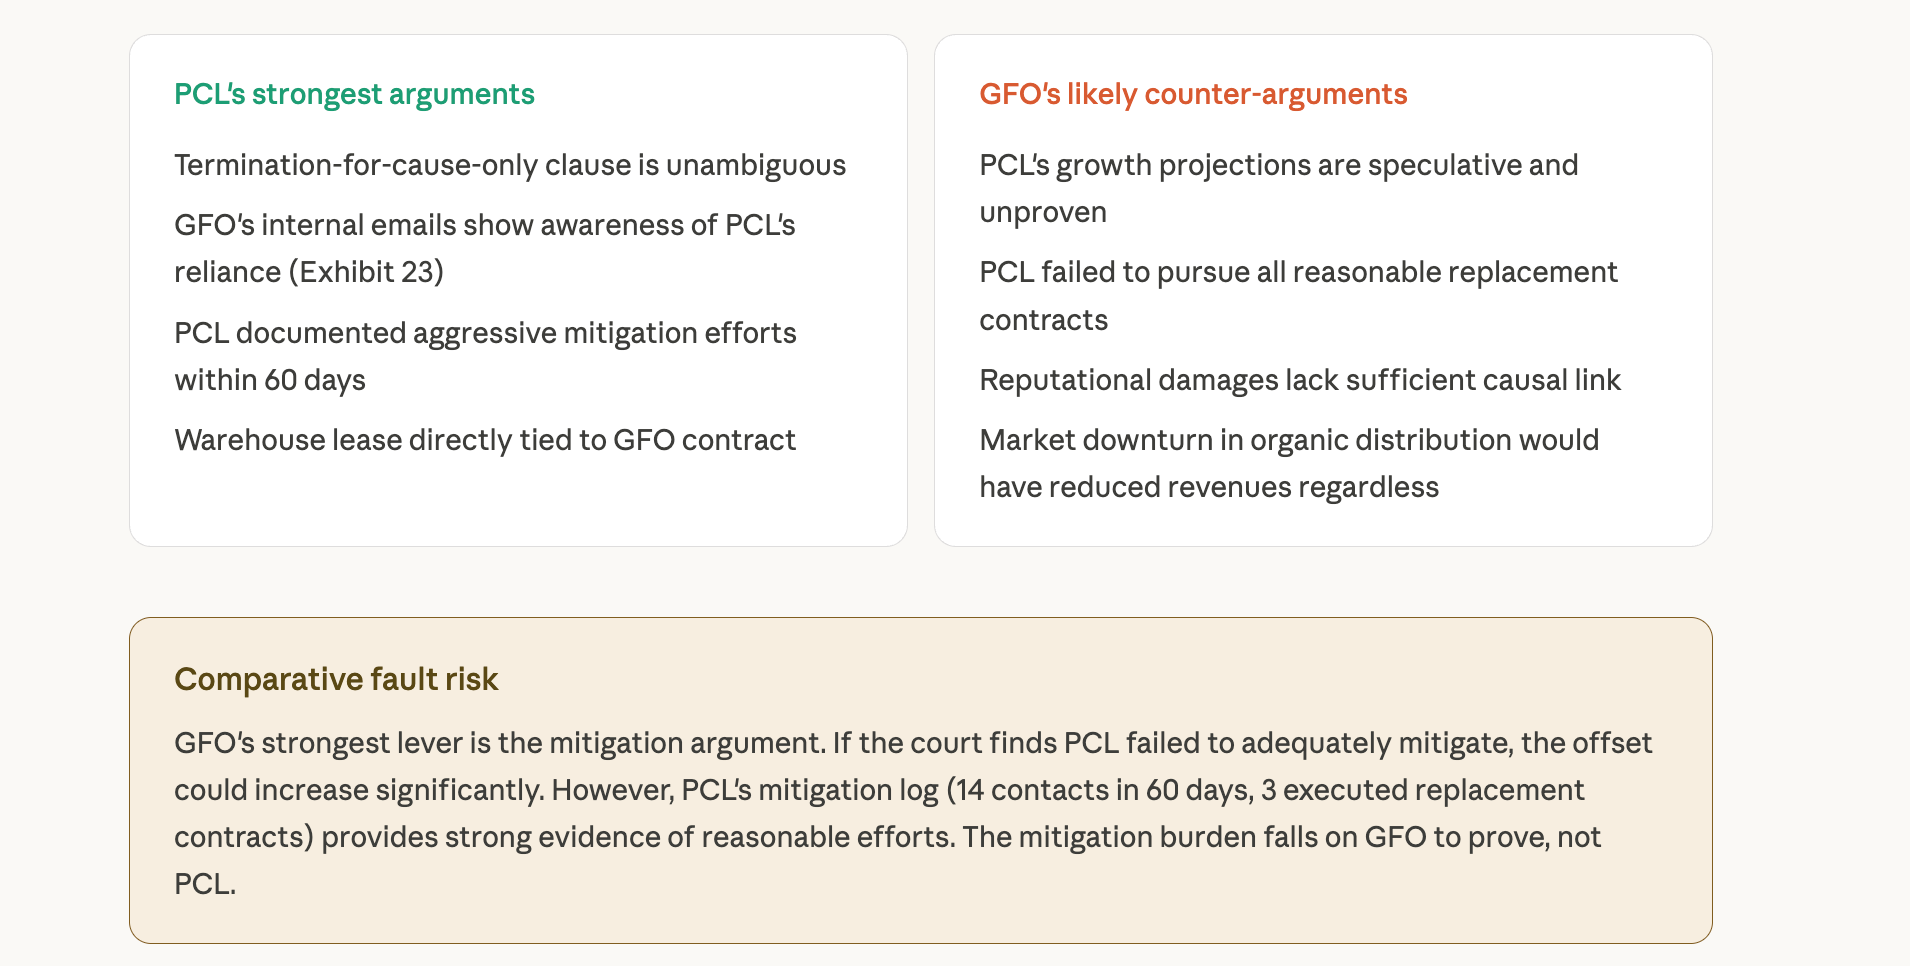
What if instead you just said, “Show me damages under three assumptions. Shorter disruption period, moderate growth, aggressive mitigation. Now change the discount rate. Now isolate the wage component. Now compare settlement value at 60, 75, and 90 percent of modeled damages.”
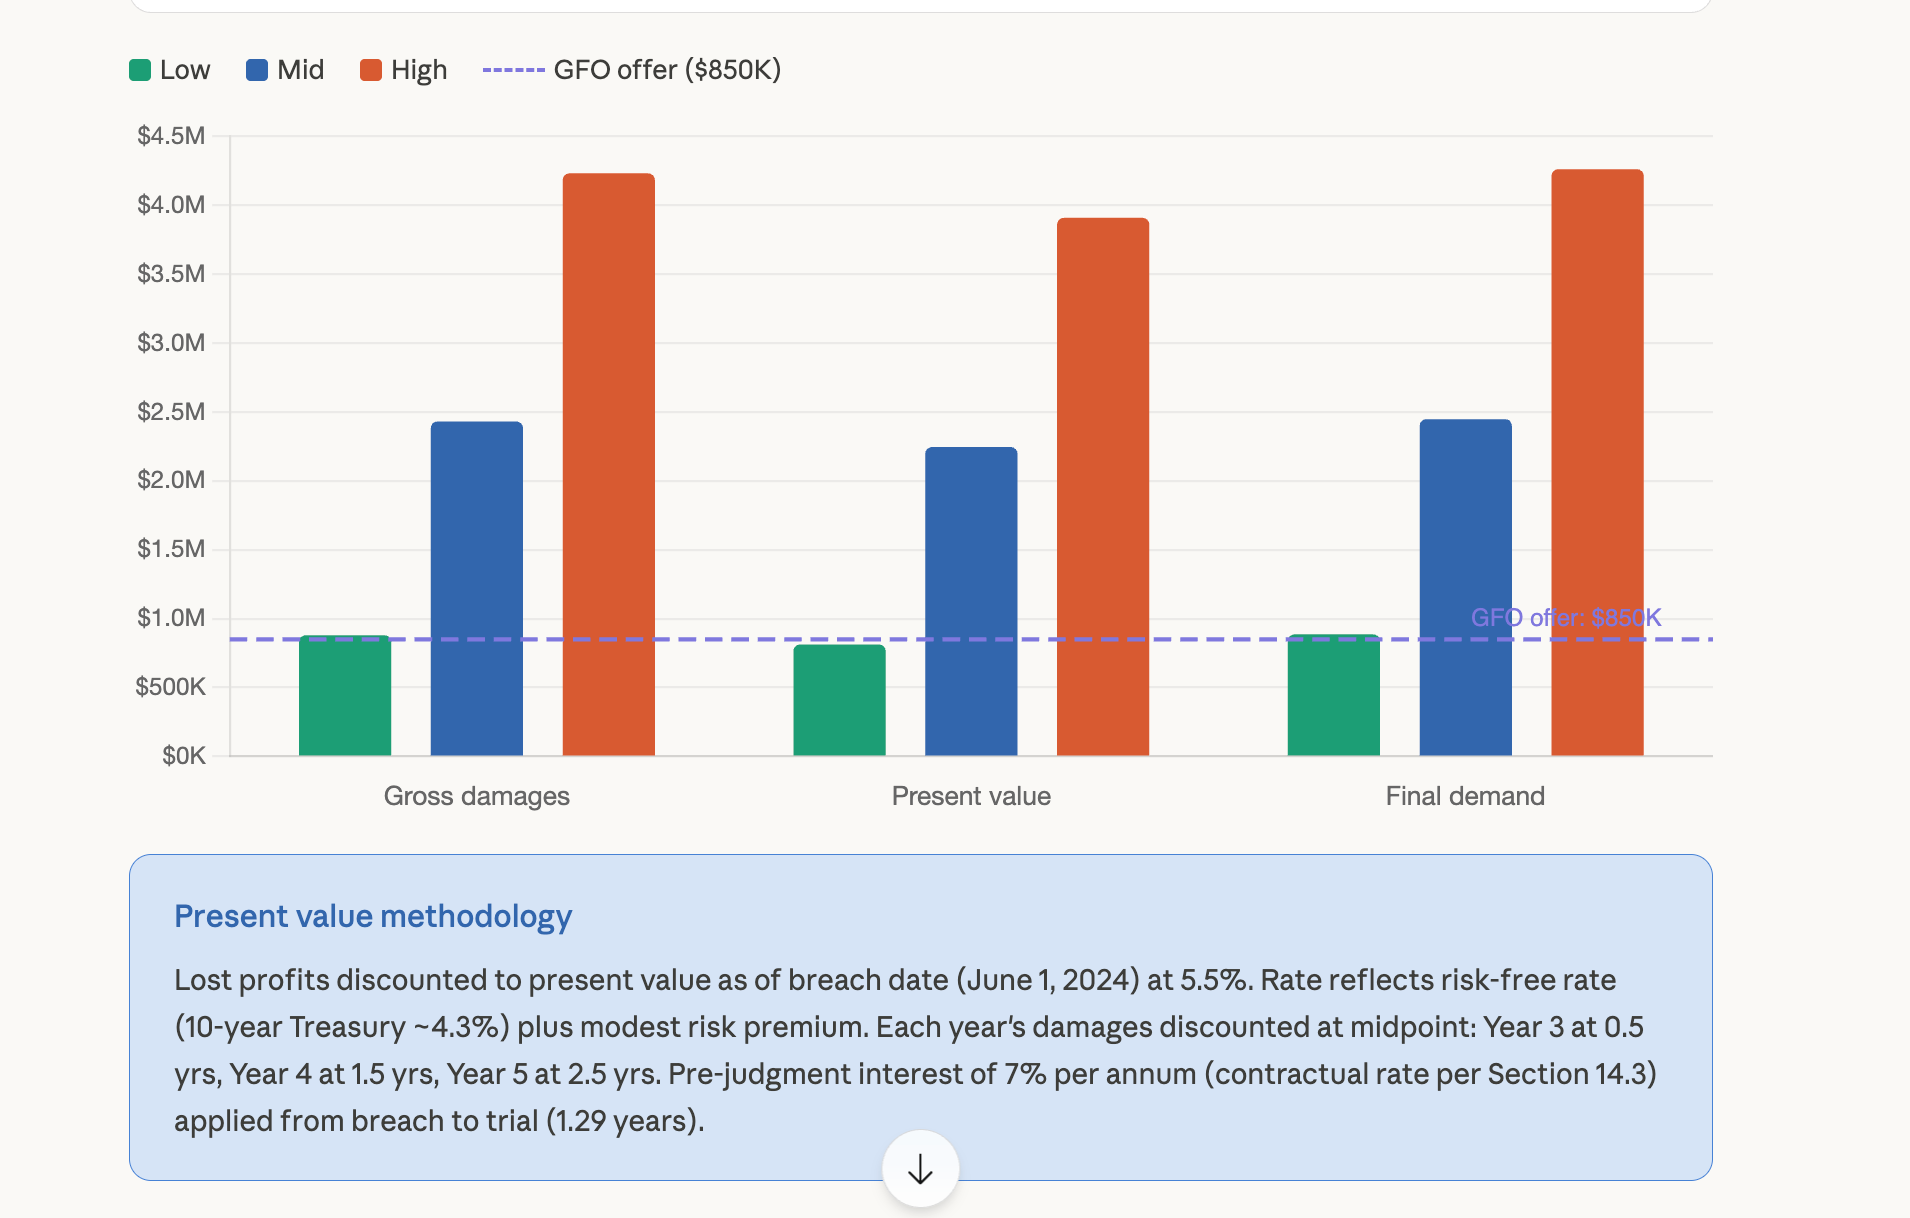
I built exactly this. Interactive chart, three scenarios, curves updating as I toggled between them. Took maybe two minutes.
Now picture a settlement conference. Opposing counsel throws out a number. Instead of “let me go back and run the numbers,” you pull up your model right there, adjust the assumptions to match their position, and show your client what that settlement actually looks like against your trial projections. In real time. While everyone’s still in the room.
I don’t think people appreciate how different that is from “I’ll get back to you with the numbers next week.”
Family law, same deal. Support scenarios, asset division alternatives, tax impacts, future earning assumptions, business valuation ranges. All stuff that benefits from a live visual where the real question isn’t “What is the number?” but “What drives the number?”
Way smarter conversation.
Before You Run With This
I’m bullish. But I’d be doing you a disservice if I didn’t flag a few things.
A clean chart can still rest on a bad assumption. A good-looking visual can still oversimplify a disputed record. That’s the danger with anything that looks polished coming out of AI: people trust it too fast. So verify everything. Check the dates on that timeline. Confirm the math in that model. You’re still the attorney.
Confidentiality. Same rules as always. Know your platform settings. Know your client obligations. Know what you’re pasting in. If you’re on a Teams or Enterprise plan, the data protections are already there. Consumer account? Be thoughtful about what you share. This isn’t new advice, but it bears repeating.
And look, the right use is exploratory first, final later. Think of this as a fast front-end for thinking, strategy, and communication. Your finished court exhibit or expert model probably still needs a more controlled workflow. That’s fine. The value here is getting to clarity faster, not skipping the rigor.
One more thing: it’s beta software and the visualizations take 15 to 30 seconds to generate. You might need to tell Claude to fix labels or adjust the layout. Iterating is quick, but don’t expect perfection on the first shot.
What I’d do Monday morning
Pick one current matter and rebuild the timeline in Claude. Compare it to what you’d build manually.
Take one estate plan you explain often and ask Claude to turn it into a client-facing flowchart.
Build a simple damages or support model with three scenarios. Adjust the assumptions and watch the chart respond.
Challenge the output. Change an assumption and see if the visual holds up or reveals a weakness in your logic.
Start with work you already know well. Compare it to your current process. That’s always the honest test.
The best legal AI tools aren’t the ones that sound futuristic. They’re the ones that help you think more clearly, explain things more simply, and make better decisions with a client sitting across from you. This one has a real shot at doing that. Not because it makes prettier pictures. Because it helps turn legal complexity into something people can finally see.
Go try it. You’ll know in five minutes.
If you read this far, you’re not looking for another product announcement. You’re trying to figure out whether this actually changes anything about how your attorneys work with clients and how your firm thinks about AI spend. That’s the right question, and it’s harder to answer than most vendors want to admit.
That’s the conversation I have every day with firm leaders who are past the hype and into the operational details. If you’re working through where visual AI fits in your practice, or whether your current tools are covering the right gaps, send me a note at steve@intelligencebyintent.com. Tell me what you’re seeing. I’ll tell you what I’m seeing, honestly, including what’s not ready yet.